I have recently released a new standardisation of SUMI. This page gives details of this standardisation. It is based on uses of SUMI from the online administration over the past five years.
There are nearly 3,000 individual SUMI records in the standardisation database, and more than 100 different applications. The applications fall roughly into the following categories:
When scoring data from a respondent, item scores are weighted according to (1) the amount the item contributes to the sub-scale total and (2) the prevalence of each response category in the database; sub-scale scores are summed, converted to the standard normal score and then re-expressed as a t-score (meaning, belonging to a population whose mean is 50 and standard deviation is 10).
The SUMI Global and sub-scale scores range from the upper 20s (ie, two and a bit standard deviations below the mean) to the lower 70s (ie, two and a bit standard deviations above the mean). The span of four standard deviations encloses 99.99% of all data from a normally distributed population. You can't get more precision from a subscale of ten items with a response surface of three choices.
Because the data are fairly normally distributed (see the section on parameters, below) we can use 95% confidence intervals around the means of the subscales with full justification. The following table gives a grading for the values in the Global and subscales:
| 60+ | A | : | high |
| 55 - 60 | B | : | good |
| 50 - 55 | C+ | : | above average |
| 45 - 50 | C- | : | below average |
| 40 - 45 | D | : | poor |
| 35- | E | : | low |
This means, if your Global or sub-scale average is within one of the above bands, and the 95% confidence intervals do not go far beyond those bands, you are able to use the above designation for your Global or sub-scale average. Don't forget that SUMI scores are given to one decimal place so averages on the exact boundary are rare.
In practice, you will usually find that your scale averages are also echoed in the free-form comments supplied by your respondents. The free-form comments usually add valuable insight into the 'why' question.
| Glob | Effi | Affe | Help | Cont | Lear | |
|---|---|---|---|---|---|---|
| min | 26.85 | 28.08 | 28.42 | 25.29 | 25.75 | 28.11 |
| mean | 50.00 | 50.00 | 50.00 | 50.00 | 50.00 | 50.00 |
| max | 74.49 | 71.67 | 71.19 | 74.28 | 74.53 | 72.17 |
| stdev(p) | 10.00 | 10.00 | 10.00 | 10.00 | 10.00 | 10.00 |
| skewness | 0.14 | 0.11 | 0.10 | -0.11 | 0.07 | -0.06 |
| ex. kurtosis | -0.47 | -1.11 | -0.78 | -0.51 | -0.35 | -0.65 |
The two important items in the above table are the Skewness and the Extreme Kurtosis.
The Skewness parameters for Global and the sub-scales are well within a tolerable range. A positive Skewness indicates a tendency for the mean to go towards the low end, a negative skewness, a tendency for the mean to go to the high end.
The Extreme Kurtosis parameters for Efficiency and Affect indicate that there is more bunching up of data at the low ends of the distributions; in general, all the distributions can be characterised as "slightly bottom heavy." Therefore SUMI means may in fact very slightly under-estimate the true value of each scale. Usually, the analyst will find that the median for each scale will be slightly higher than the mean in each sample because of the negative Extreme Kurtosis parameters of the population distribution.
In the following graphs, the actual cumulative frequency curves (ogives) for the Global and each sub-scale are plotted against the expected values of the standard normal distribution. It will be seen that the actual distributions follow the theoretical normal quite closely, given that the size of the population database is what professional statisticians would call "small" (ie, less than 10,000).
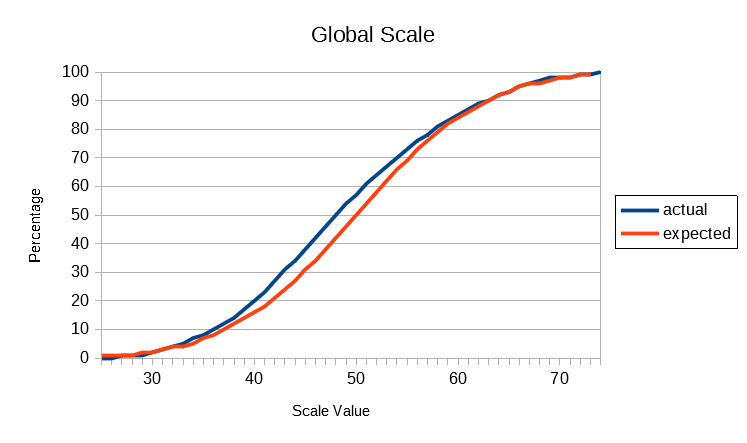
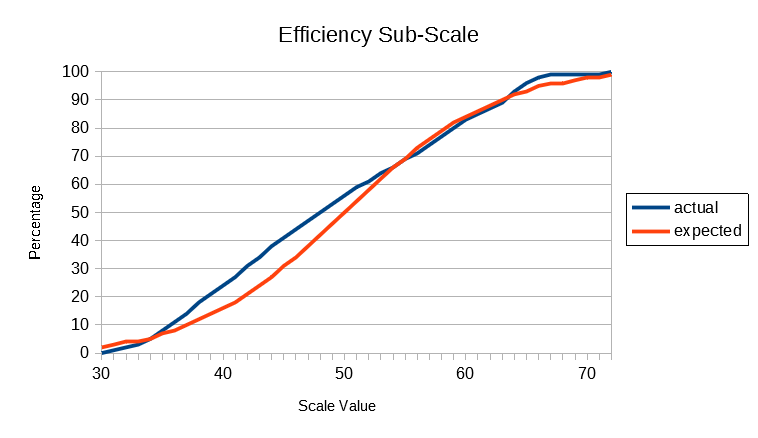
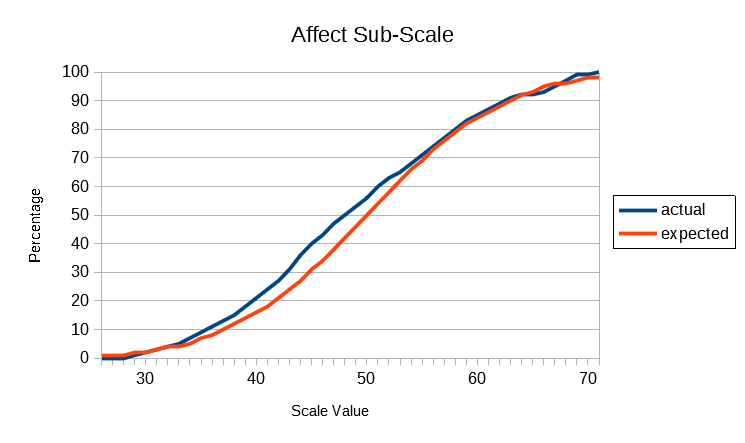
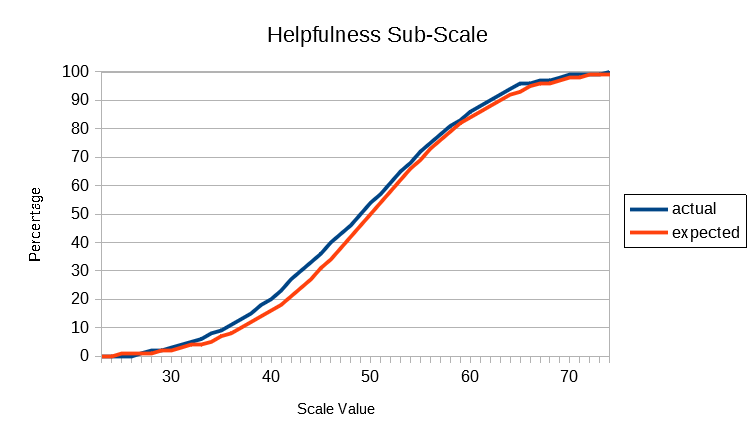
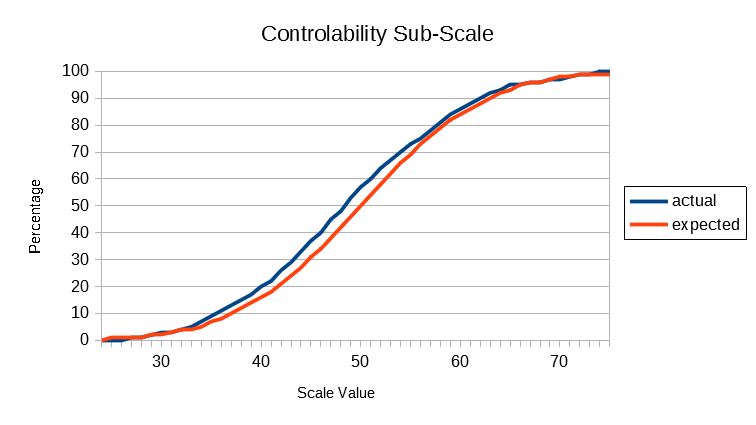
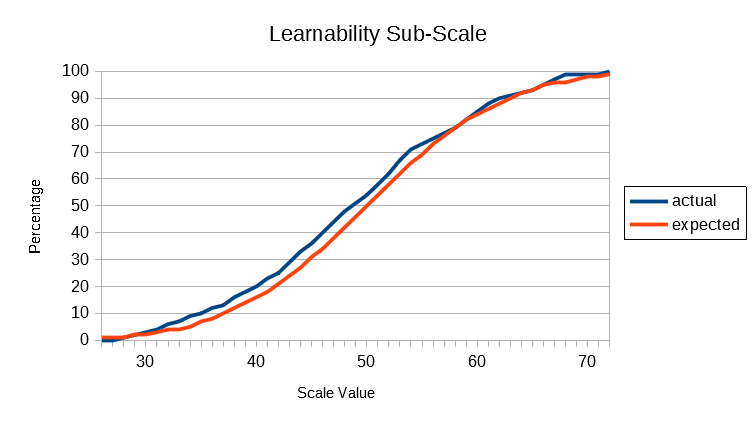
The above results show that SUMI scores are distributed according to a normal distribution pattern. Unlike many preference scales in current use for measuring User Experience SUMI scores do not bunch up at the top of the scale. This is called a ceiling effect and detracts from the usefulness of such scales (unless of course the systems being evaluated are truly awful as they might have been 20 years ago.) All the SUMI scales go up smoothly: there's room at the bottom and lots of room at the top.
The reliability of the SUMI scales is high using the Cronbach algorithm. Global is especially high because it's longer than the sub-scales; however each subscale has a respectable amount of reliability, indicating that the questions are not merely a repetition of each other but do actually reference different aspects of the attitude which that sub-scale is measuring.
| Global | 0.917 | ||||
| Efficiency | 0.850 | ||||
| Affect | 0.880 | ||||
| Helpfulness | 0.810 | ||||
| Control | 0.759 | ||||
| Learnability | 0.843 |
| Effi | Affe | Help | Cont | Lear | |
|---|---|---|---|---|---|
| Glob | 36.53% | 36.01% | 79.02% | 58.33% | 15.55% |
| Effi | 30.83% | 14.29% | 26.37% | 30.34% | |
| Affe | 18.29% | 30.09% | 15.14% | ||
| Help | 29.03% | 3.89% | |||
| Cont | 15.13% |